Apple Hospitality REIT (APLE)·Q4 2025 Earnings Summary
Apple Hospitality REIT Q4 2025: Beat Consensus But RevPAR Decline Continues as Government Travel Pullback Weighs
February 24, 2026 · by Fintool AI Agent
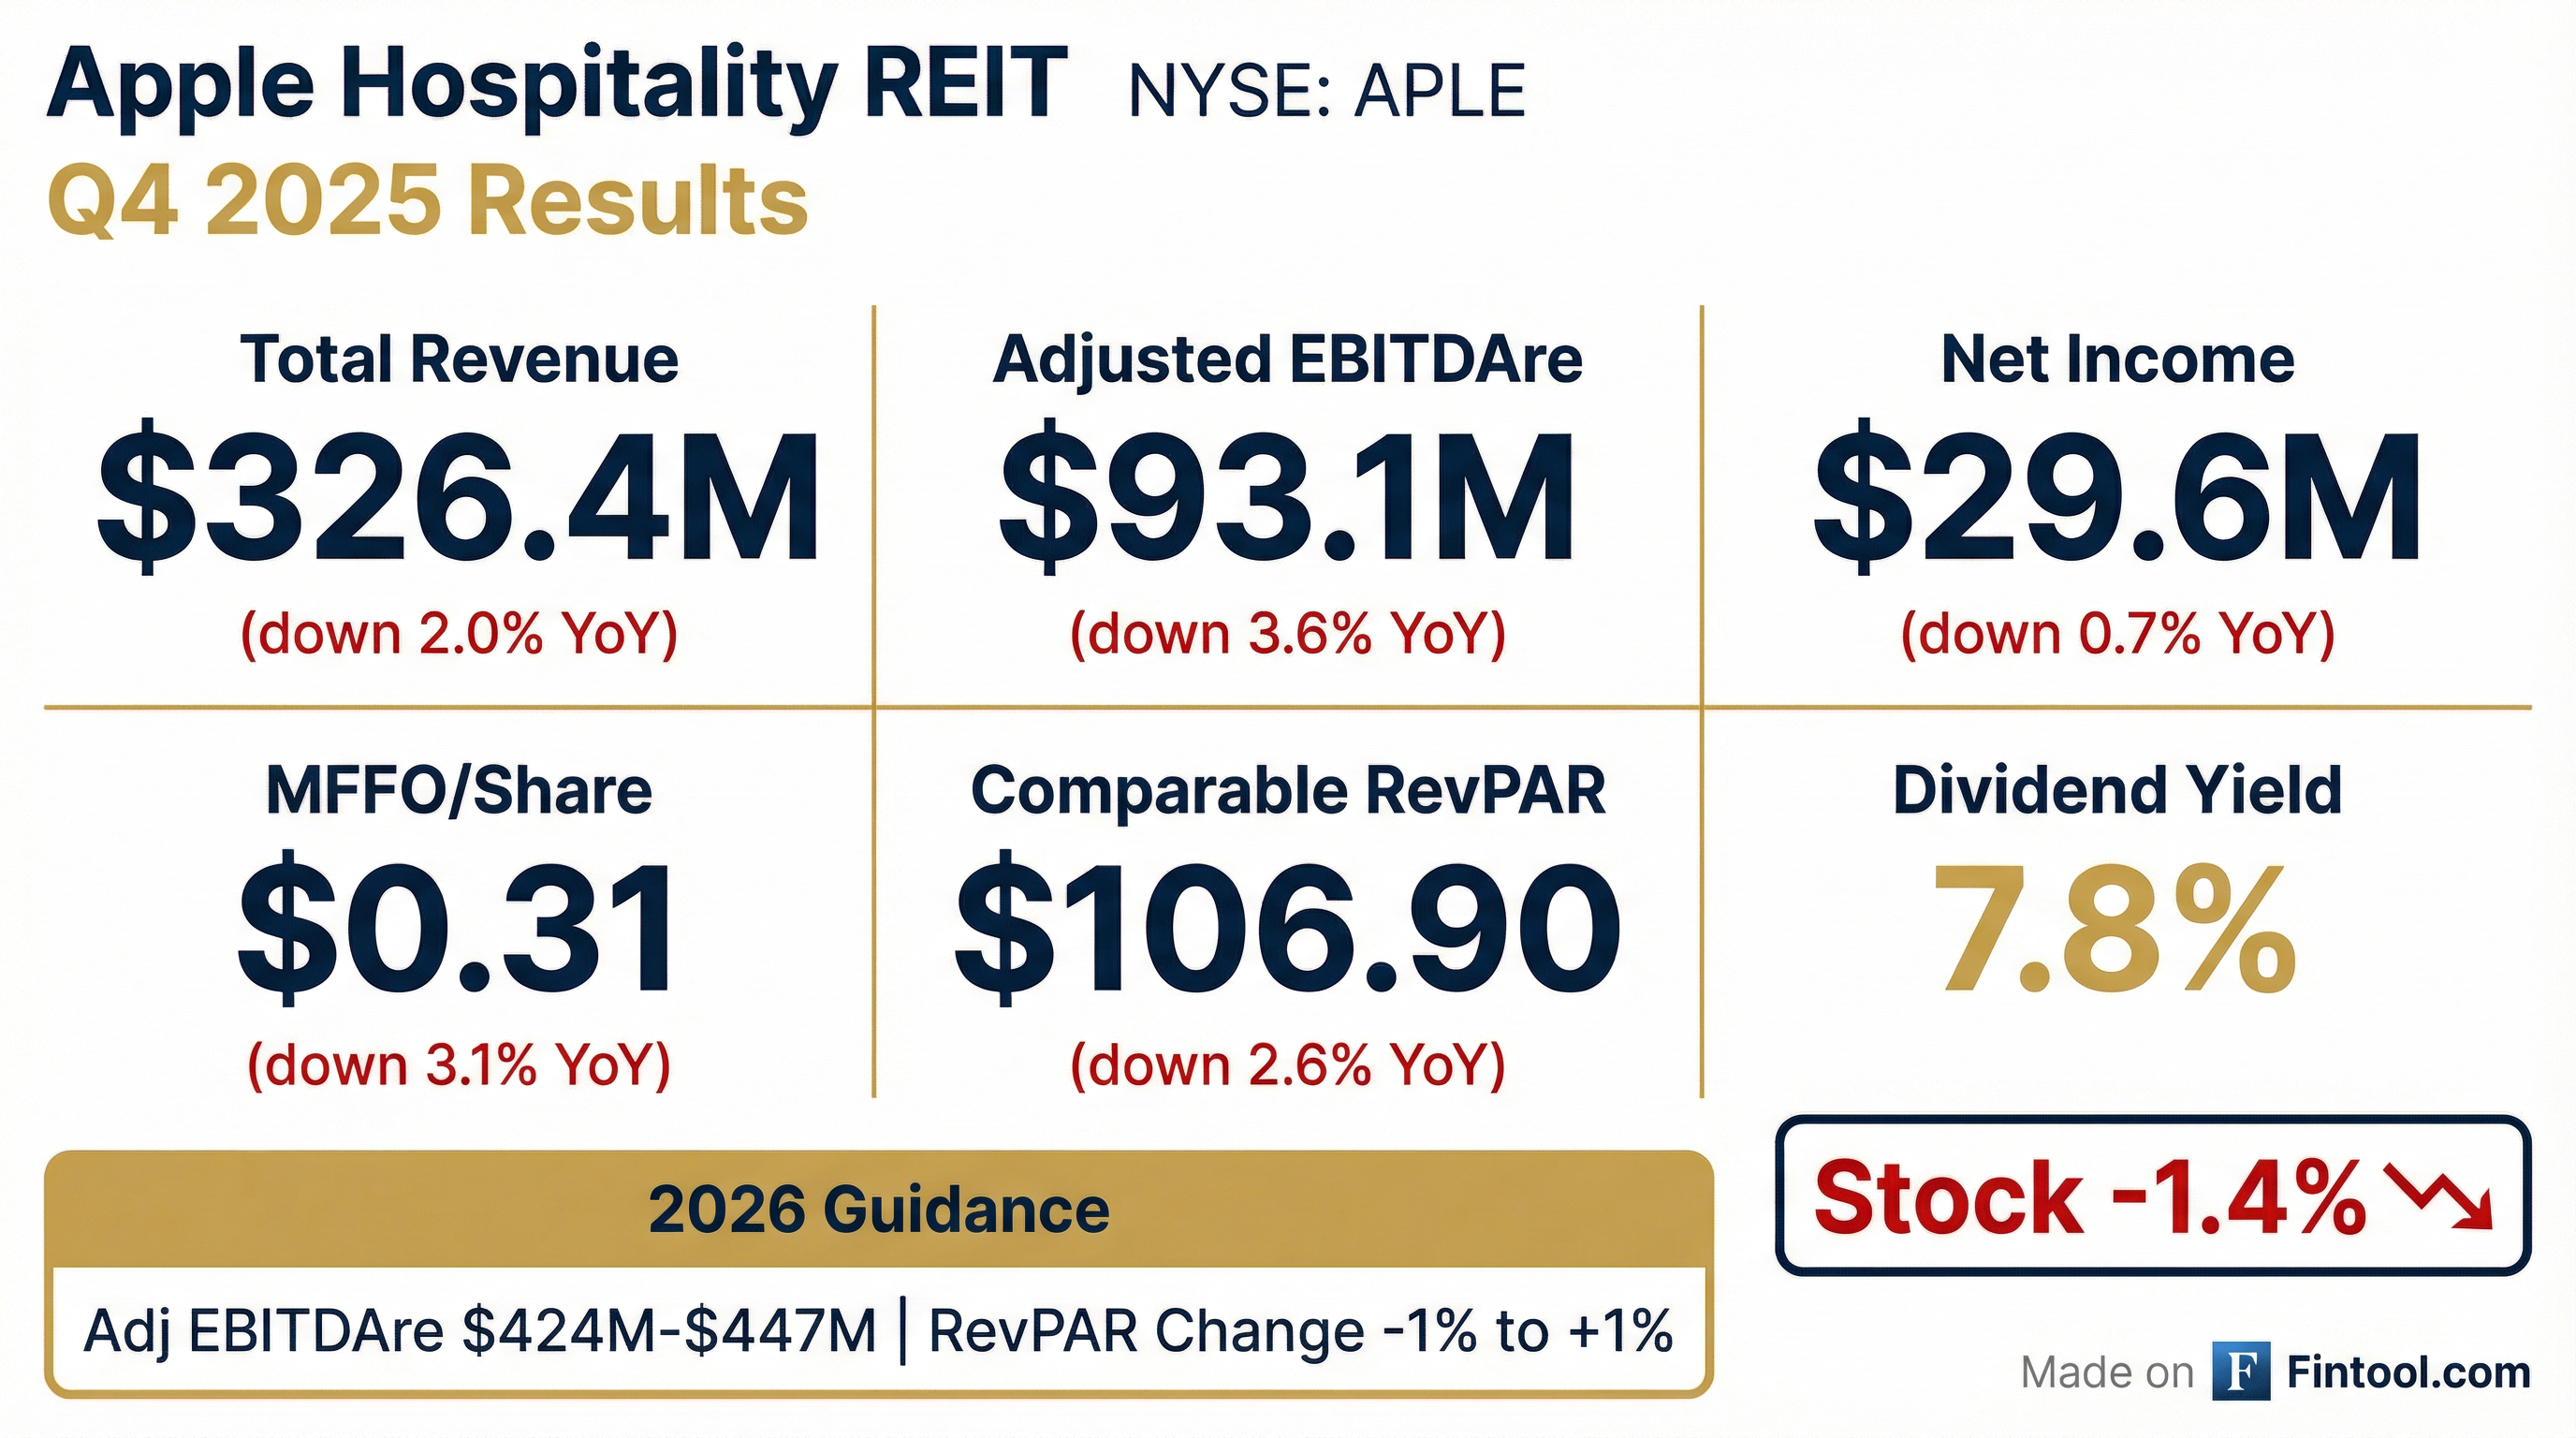
Apple Hospitality REIT (NYSE: APLE) reported Q4 2025 results that beat Wall Street estimates despite ongoing headwinds from reduced government travel and softer midweek occupancy. Revenue of $326.4M beat consensus by 1.2%, and Adjusted EBITDAre of $93.1M beat by 3.5%.* However, Comparable Hotels RevPAR fell 2.6% year-over-year to $107, driven by a 1.7% decline in occupancy and 0.9% decline in ADR. The stock has fallen ~3% since the release.
Did Apple Hospitality Beat Earnings?
Yes — APLE beat Wall Street estimates on all major metrics despite year-over-year operating declines:
The beats relative to consensus mask year-over-year operating weakness. Here's the full picture:
The Adjusted Hotel EBITDA margin contracted 210 basis points to 31.1%, reflecting operating deleverage as revenues declined while certain fixed costs remained stable.
What Drove the RevPAR Decline?
CEO Justin Knight attributed the challenging quarter to two primary factors: policy uncertainty and reduced government travel.
"During the year, leisure travel remained strong across our hotel portfolio while policy uncertainty and a pullback in government travel impacted midweek demand, temporarily disrupting the steady improvement in midweek occupancy that characterized much of 2024."
Q4 Channel Mix Shifts (same-store):
- Brand.com: flat at 40%
- OTA: +110 bps to 14%
- Property direct: +70 bps to 25%
- GDS: -80 bps to 16%
Q4 Segmentation (same-store):
- BAR (leisure): flat at 33%
- Other discounts: +30 bps to 31%
- Corporate/negotiated: -150 bps to 16%
- Government: -100 bps to just 4%
- Group: +130 bps to 15%
The group business growth (+130 bps) directly reflects management's strategy to backfill lost government demand.
The monthly breakdown reveals the seasonal pattern and October-November weakness:
January 2026 preliminary results showed RevPAR declining approximately 1.5% year-over-year, impacted by winter weather disruption and tough comparisons to California wildfire recovery business and presidential inauguration travel in January 2025. Performance has improved in February, bringing comparable RevPAR growth "slightly positive year to date."
Q&A Highlights: What Management Revealed
The earnings call Q&A provided significant additional color on key investor concerns:
Government Travel Impact Quantified
CFO Liz Perkins put numbers to the DOGE and government shutdown impact for the first time:
"If you look at room nights for government on a same-store basis, for the full year, they were down about 12%, and negotiated was down 5%-6%... the total of those could be about a point in occupancy."
Management noted some of this demand "may not return" from a DOGE perspective, which is why teams "worked really, really hard to optimize the mix of business and replace some of that with group business throughout the year."
Marriott Transition: "Infinitely More Marketable"
CEO Justin Knight provided strong commentary on the 13 Marriott-managed hotels transitioned to franchise in January 2026:
"It makes them infinitely more marketable. We have tremendous amount of flexibility to sell, at this point, those assets unencumbered by management, which meaningfully increases the potential buyer pool."
Key benefits expected:
- Cost consolidation: Combining management within markets with existing third-party operators
- Lower overhead: Meaningful reductions in Marriott overhead allocations
- Fee savings: ~$5M net benefit from brand conference elimination and fee reductions
FIFA World Cup: Excited but Not in Guidance
Management expressed optimism about the FIFA World Cup 2026 but noted it's "too soon to tell" for guidance:
"We are incredibly excited about the potential for incremental business and incremental travel related to the World Cup... The booking window is still short. A significant part of the reason that at the midpoint of guidance, we're not reflecting the optimism we have about the potential business is because from our perspective, it's too soon to tell."
Late Q2 is when APLE expects the most benefit based on match schedules.
Signs of Business Travel Recovery
Encouraging signals emerged for midweek demand:
"What we are seeing is encouraging from a midweek occupancy perspective. We believe that that translates to business transient... we are seeing an improvement in GDS bookings, which is business-oriented."
However, Perkins cautioned: "We're a little gun-shy because we were seeing slow and steady business transient growth up until the announcement of DOGE... That's really when that trend pulled back."
How Did the Stock React?
The stock has declined ~3% cumulatively since the February 23rd release — falling 1.5% on release day to $12.21 and another 1.7% today to $12.06 following the earnings call. This continues a pattern of negative reactions to recent quarterly reports despite beating consensus estimates.
The stock is trading near its 52-week midpoint ($10.44 low, $14.96 high), with the current 8.0% dividend yield providing support at these levels.
What Did Management Guide for 2026?
Management provided 2026 guidance that implies a stabilization but not yet a return to growth:
Expense Guidance Breakdown (from Q&A):
- Variable expenses: ~2.7% growth at midpoint
- Fixed expenses: ~4.5% growth at midpoint
- Same-store expense growth: only 1.6% at midpoint
Notably, management acknowledged their guidance "could ultimately prove conservative" given potential tailwinds:
- FIFA World Cup 2026 — Summer leisure travel boost from matches hosted in U.S. cities (late Q2 benefit expected)
- Easier comparisons — Lapping periods impacted by government spending cuts, tariff announcements, and government shutdown
- Policy stabilization — Reduced uncertainty could support midweek business travel recovery
2026 Quarterly Cadence (from Q&A):
- Q1: Weakest (California wildfire comp, weather impact)
- Q2-Q3: Fairly flat, potential FIFA uplift late Q2
- Q4: Strongest growth (government shutdown comp from 2025)
What Changed From Last Quarter?
Several notable developments from Q3 2025 to Q4 2025:
Operating Trends:
- RevPAR decline accelerated from -1.8% in Q3 to -2.6% in Q4
- EBITDA margin compression continued (35.2% Q3 → 31.1% Q4) reflecting typical seasonality plus incremental operating pressure
Transactional Activity:
- December 2025: Acquired Motto by Hilton Nashville Downtown
- Full year 2025: Sold 7 hotels for $73M combined (6.5% cap rate, 12.4x EBITDA pre-CapEx)
- Development pipeline: AC Hotel Anchorage (groundbreaking, late 2027 delivery), AC/Residence Inn Las Vegas (Q2 2028)
January 2026 Marriott Transition:
- 13 Marriott-managed hotels transitioned to franchise
- Consolidated with third-party managers already operating APLE hotels in-market
- Increases flexibility and marketability for potential future dispositions
Capital Allocation:
- Repurchased 1.1M shares in Q4 for $13.1M (avg $11.77/share)
- $242.5M remaining under Share Repurchase Program
- No shares issued under ATM program
Full Year 2025 Performance
The full year numbers paint a picture of a portfolio navigating a challenging demand environment:
The 18% decline in net income appears outsized relative to RevPAR decline, reflecting impairment charges of $5.7M recognized in Q3 2025 on hotels sold in Q4, as well as higher interest expense from the refinanced term loan.
Balance Sheet and Liquidity
Apple Hospitality maintains a conservative balance sheet relative to peers:
In July 2025, the company entered a new $385M term loan at SOFR + 1.35-2.20% (based on leverage), extending maturity to 2030 and providing additional liquidity.
Geographic Performance
Top performing and underperforming markets in Q4 2025 (by RevPAR change):
Outperformers:
Underperformers:
The Florida weakness (Orlando -20%, Tampa -24%) reflects normalization after strong post-COVID leisure travel and hurricane disruption comparisons.
Dividend and Capital Return
APLE continues to prioritize returning capital to shareholders through its monthly dividend:
- Q4 2025 distributions: $0.24/share ($57.0M total)
- Full year 2025 distributions: $1.01/share ($240.4M total)
- Current annualized dividend: $0.96/share (8.0% yield at $12.06)
- 2025 share repurchases: 4.6M shares for $58.3M (avg $12.55)
The combination of dividends plus buybacks represented a total shareholder return of capital of approximately $299M in 2025 versus MFFO of $361M, representing an 83% payout ratio.
What to Watch
Near-term catalysts:
- Q1 2026 results (late April/early May) — First quarter under new guidance framework
- FIFA World Cup 2026 booking trends (June-July matches)
- Government travel policy stabilization signals
Key metrics to monitor:
- Midweek occupancy recovery (key indicator of business travel normalization)
- RevPAR Index vs. STR industry (company noted outperformance in Q4/FY25)
- Acquisition pipeline execution (AC Hotel Anchorage, Las Vegas development)
Risks:
- Tariff-related macro uncertainty could further pressure business travel
- Operating cost inflation (management noted potential capex cost increases from tariffs)
- Supply growth in key markets
This analysis is based on Apple Hospitality REIT's 8-K filed February 23, 2026 and earnings call transcript from February 24, 2026. Consensus estimates from S&P Global.